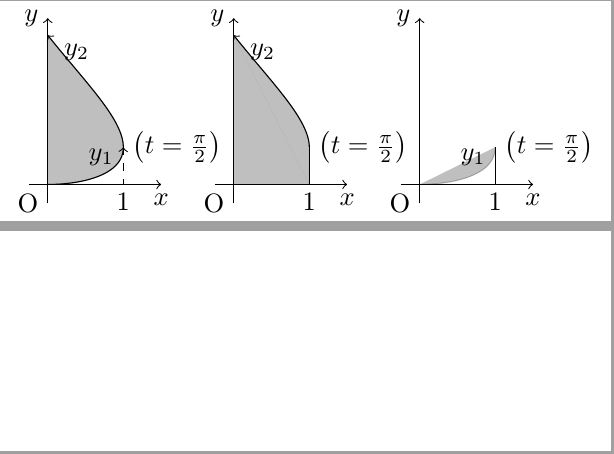
こんにちは.tikz pictureを利用しているのですが,以下のコードを読み込んでも右側のグラフの色塗りが思うようにいきませんでした.
左側の曲線が元のもの(x(t)=sin t y(t)=(t^2)/5),それをx軸方向に平行移動し,加工している状態です.それで問題になっているのは右側のグラフで 曲線y1と, x軸, x=1で囲まれる部分を色塗りをしようとしているのですが,どうしてもうまくいきませんでした.どうぞご教示していただければと思います.よろしくお願いいたします.
\documentclass[dvipdfm]{standalone}
\usepackage{tikz}
\begin{document}
\scalebox{2}[2]{
\begin{tikzpicture}[declare function={
myx(\t) = sin(\t r);
myy(\t) = \t * \t/5;
my2x(\t) = and(\t <= pi, \t >= pi/2) * (sin(\t r)) + and(\t>=0, \t < pi/2) * (1);
my2y(\t) = and(\t <= pi, \t >= pi/2) * (\t * \t) /5 + and(\t>=0, \t < pi/2) * pi*(\t/10);
my3(\t) = asin(\t) * (asin(\t)/(5));
}
]
% 座標軸
\draw[->] (-0.25,0) -- (1.5,0) node[below] {$x$};
\draw[->] (0,-0.25) -- (0,2.2) node[left] {$y$};
\draw (0,0) node[below left] {$\mathrm{O}$} coordinate (O);
% 曲線の媒介変数表示
\draw[->] plot[domain=0:{pi/2}, variable=\t, smooth]({myx(\t)}, {myy(\t)});
\draw[->] plot[domain={pi/2}:{pi}, variable=\t, smooth]({myx(\t)},{myy(\t)});
\draw[fill,opacity=.25] plot[domain=0:{pi}, variable=\t, smooth]({myx(\t)}, {myy(\t)});
\draw[dashed] ({myx(pi/2)}, {myy(pi/2)}) -- ({myx(pi/2)}, {0}) node[below]{$1$};
\node[above] at ({myx(pi/4)},{myy(pi/4)}) {$y_{1}$};
\node[above] at ({myx(3.5*pi/4)},{myy(3.5*pi/4)}) {$y_{2}$};
\node[right] at ({myx(pi/2)},{myy(pi/2)}) {$\left( t=\frac{\pi}{2}\right)$};
\begin{scope}[xshift=70, yshift=0]
% 座標軸
\draw[->] (-0.25,0) -- (1.5,0) node[below] {$x$};
\draw[->] (0,-0.25) -- (0,2.2) node[left] {$y$};
\draw (0,0) node[below left] {$\mathrm{O}$} coordinate (O);
% 曲線の媒介変数表示
\draw[->] plot[domain={pi/2}:{pi}, variable=\t, smooth]({my2x(\t)},{my2y(\t)});
\draw[fill,opacity=.25] plot[domain=0:{pi}, variable=\t, smooth]({my2x(\t)}, {my2y(\t)});
\fill[opacity=.25] (O) -- (1,0) -- ({my2x(pi)},{my2y(pi)}) -- (O);
\node[above] at ({myx(3.5*pi/4)},{myy(3.5*pi/4)}) {$y_{2}$};
\node[right] at ({myx(pi/2)},{myy(pi/2)}) {$\left( t=\frac{\pi}{2}\right)$};
\draw ({myx(pi/2)}, {myy(pi/2)}) -- ({myx(pi/2)}, {0}) node[below]{$1$};
\end{scope}
\begin{scope}[xshift=140, yshift=0]
% 座標軸
\draw[->] (-0.25,0) -- (1.5,0) node[below] {$x$};
\draw[->] (0,-0.25) -- (0,2.2) node[left] {$y$};
\draw (0,0) node[below left] {$\mathrm{O}$} coordinate (O);
% 曲線の媒介変数表示
\draw[fill,opacity=0.25] plot[domain={0}:{pi/2}, variable=\t, smooth]({myx(\t)},{myy(\t)});
\node[above] at ({myx(pi/4)},{myy(pi/4)}) {$y_{1}$};
\node[right] at ({myx(pi/2)},{myy(pi/2)}) {$\left( t=\frac{\pi}{2}\right)$};
\draw({myx(pi/2)}, {myy(pi/2)}) -- ({myx(pi/2)}, {0}) node[below]{$1$};
\end{scope}
\end{tikzpicture}
}
\end{document}