(このページは岡山大学の垂水先生のページのミラーです)
library("ggplot2")
str_replace<-function(d,pat,a) {
sub(pat,a,d)
}
dwater <- read.csv('http://face.f7.ems.okayama-u.ac.jp/~t2/data/stat/mext-water.csv',
fileEncoding="sjis", skip=2, na="-", as.is=TRUE)
dwater[(!is.na(dwater[,4]))&(dwater[,4]=="不検出"),4]<-0
dwater[,4]<-as.numeric(dwater[,4])
location<-dwater$都道府県
dwater$都道府県 <- str_replace(location,"(.*)","")
dest.pref<-c(8:15,19)
dtemp<-dwater[dwater$pref%in%dest.pref,]
lct <- Sys.getlocale("LC_TIME"); Sys.setlocale("LC_TIME", "C")
ttime <- strptime(dtemp[,3], "%m月%d日")
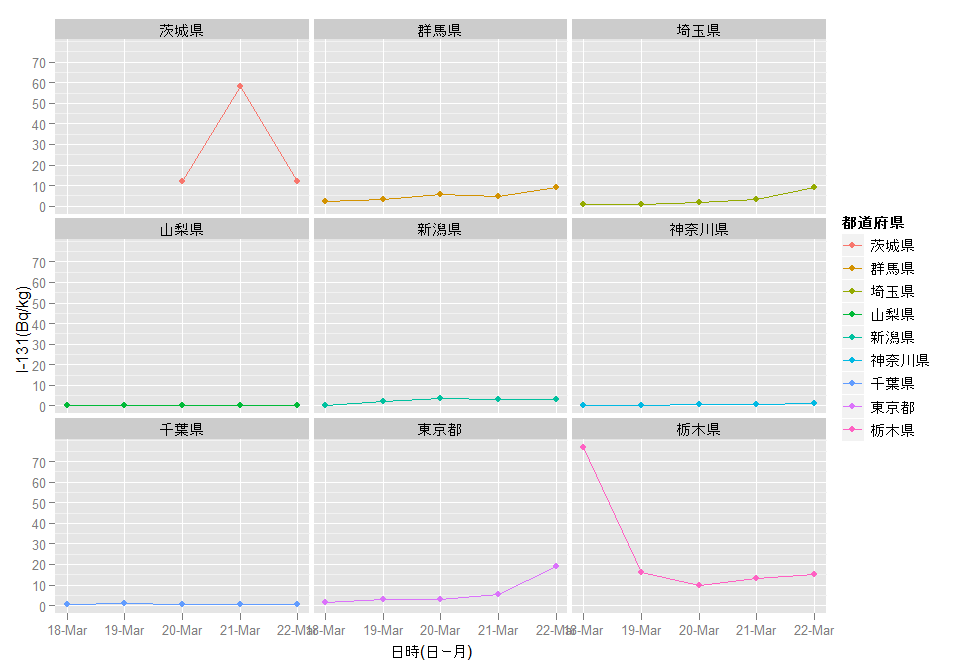
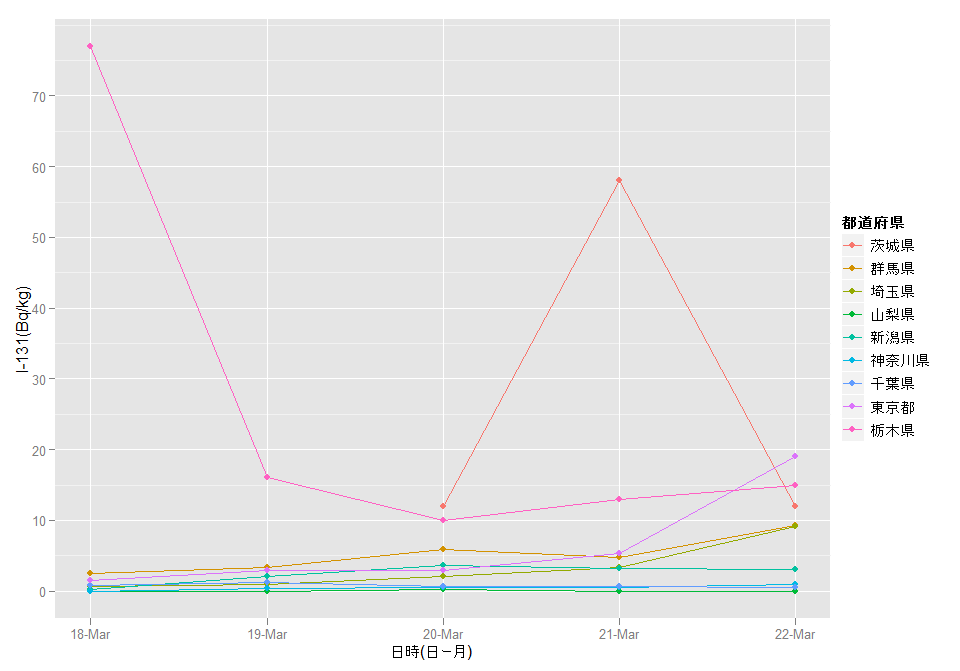
G <- ggplot(dtemp, aes(as.POSIXct(ttime), I.131, colour=都道府県)) +
geom_line() + geom_point() + xlab("日時(日ー月)") + ylab("I-131(Bq/kg)")
G + facet_wrap(~都道府県)