Rには等分布(等分散)を仮定しない3群以上を比較するノンパラメトリックな検定 rankFD があるのにPythonにはないので、Python版rankFDをCodexで作ってみました。等分布を仮定するKruskal-Wallis検定の代わりにお使いください。
インストールは pip install rankfd です。
Rに合わせて、rankFD 関数のデフォルトはどの群の分布も同じという帰無仮説の検定、オプション hypothesis="H0p" でどの群の相対効果量(以下参照)も等しいという帰無仮説の検定(つまり等分布を仮定しない検定)ですが、デフォルトでも等分布からの外れに頑健のようです。また、デフォルトでは各群は同じ重みで扱われ、オプション effect="weighted" で各群はそのサイズ(個数)に比例した重みで扱われます(後者は従来の多くの検定の振舞い)。rankFD(x, y, hypothesis="H0p", effect="weighted") とすればBrunner-Munzel検定と同じ $p$ 値を与えます。
以下はすべて hypothesis="H0p" を付けて等分布を仮定しない検定をしています。
from rankfd import rankFD

x = [1, 2, 3, 4]
y = [2, 4, 5, 6]
z = [5, 7, 8, 9]

result = rankFD(x, y, z, hypothesis="H0p")
result
RankFDResult(statistic=15.89583333333334, pvalue=0.007214455333180363)
$p = 0.007$ です(hypothesis="H0p" を外せば $p = 0.009$ です)。
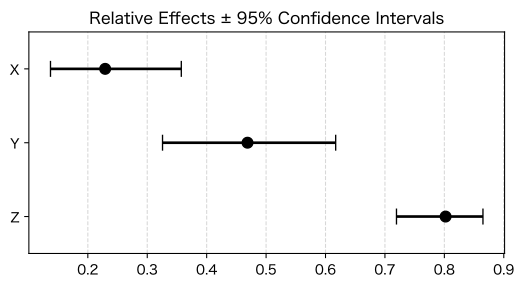
各群の相対効果量:
result.relative_effects
array([0.22916667, 0.46875 , 0.80208333])
この相対効果量は、この場合は、全データをつないだものに対する各群の勝率です。
def win(a, b):
    s = 0
    for u in a:
        for v in b:
            s += (u < v) + (u == v) / 2
    return s / (len(a) * len(b))

print(win(x+y+z, x), win(x+y+z, y), win(x+y+z, z))
0.22916666666666666 0.46875 0.8020833333333334
ただし、各群のサイズが異なる場合は、どの群の影響も等しくなるように調整を行います。例えば x = [1, 2, 3, 4, 1, 2, 3, 4] に変えたら win() の値は変わりますが、rankFD の相対効果量は変わりません。
各群の相対効果量の95%信頼区間:
result.confidence_interval
array([[0.13717182, 0.35730879],
       [0.32571492, 0.6171111 ],
       [0.71943078, 0.86495776]])
図示:
import matplotlib.pyplot as plt
import numpy as np

labels = ['X', 'Y', 'Z']
lower_err = result.relative_effects - result.confidence_interval[:, 0]
upper_err = result.confidence_interval[:, 1] - result.relative_effects
err = np.array([lower_err, upper_err])

plt.figure(figsize=(6.4, 3))

plt.errorbar(
    result.relative_effects, labels, xerr=err,
    fmt='o', color='black', ecolor='black',
    capsize=6, elinewidth=2, markersize=8
)

plt.title('Relative Effects ± 95% Confidence Intervals')
plt.grid(axis='x', linestyle='--', alpha=0.5)
plt.ylim(2.5, -0.5)
plt.savefig("rankfd0.svg", bbox_inches="tight")
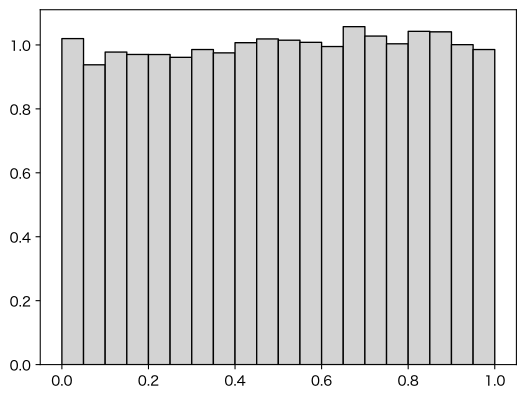
import matplotlib.pyplot as plt
import numpy as np

rng = np.random.default_rng(260726)

def p():
    x = rng.integers(1, 6, 10)
    y = rng.integers(1, 6, 10)
    z = rng.integers(1, 6, 10)
    return rankFD(x, y, z, hypothesis="H0p").pvalue

a = [p() for _ in range(100000)]
plt.hist(a, color="lightgray", edgecolor="black", bins=np.arange(21)/20, density=True)
plt.savefig("rankfd1.svg", bbox_inches="tight")
def p():
    x = rng.integers(1, 6, 10)
    y = rng.integers(1, 6, 15)
    z = rng.integers(0, 3, 20) + rng.integers(1, 4, 20)
    return rankFD(x, y, z, hypothesis="H0p").pvalue
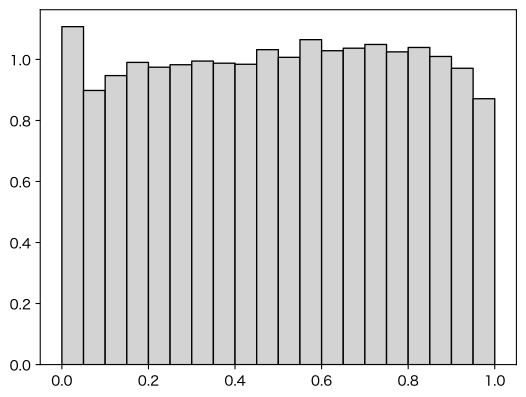
Kruskal-Wallis検定のシミュレーションと比較してください。
並べ替え検定(permutation test)を使えば小サンプルでも厳密な $p$ 値が得られます。
import math
import numpy as np
from rankfd import rankFD
from scipy.stats import permutation_test

groups = (
    np.array([1, 2, 3, 4]),
    np.array([2, 4, 5, 6]),
    np.array([5, 7, 8, 9]),
)

def rankFD_statistic(*samples):
    return rankFD(*samples, hypothesis="H0p").statistic

# 全割当数 N! / (n1! n2! ... nk!)
n_total = sum(len(x) for x in groups)
n_partitions = math.factorial(n_total) // math.prod(
    math.factorial(len(x)) for x in groups
)

print("全割当数:", n_partitions)

result = permutation_test(
    groups,
    rankFD_statistic,
    permutation_type="independent",
    n_resamples=np.inf,       # 全割当を列挙
    alternative="greater",    # 大きいほど帰無仮説に反する
    vectorized=False,
)

print("statistic =", result.statistic)
print("exact p =", result.pvalue)
statistic = 15.89583333333334
exact p = 0.00658008658008658
hypothesis="H0p" を外せば、各群が同数の場合はKruskal-Wallisの並べ替え検定と同じになります。
全割当数が大きすぎる場合には np.inf を適度に大きい整数にします。
関連手法