体重は身長の3乗に比例しそうだが,BMIは体重÷身長の2乗であるので,体重は身長の2乗に比例するのであろうか。
成人の男女別のデータがあればよいのだが,Kaggleでも乱数で生成したらしいものしか見つからない(そうでないのがあったら教えてください)。そこで,e-Statで「身長と体重の相関表 平成31年度」を検索して出てくる唯一のExcelファイルを使って,一番大きい年齢層(17歳)の男女別の身長・体重の関係を調べる。ひどいExcelファイルで,うまく印刷できるように2シートに分けてあるので,別々に読んで結合しなければならない。
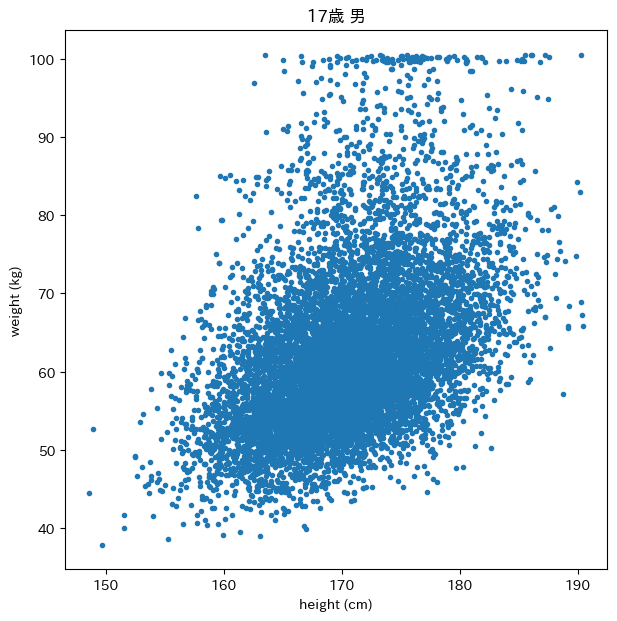
まず男子。
import pandas as pd
import numpy as np
import matplotlib.pyplot as plt

df1 = pd.read_excel("h30_hoken_eturan_01.xlsx", "10-020",
                    skiprows=[0,1,2,4], na_values="-")
df2 = pd.read_excel("h30_hoken_eturan_01.xlsx", "10-021",
                    skiprows=[0,1,2,4], na_values="-")

df = pd.concat([df1.iloc[0:46, 3:35], df2.iloc[0:46, 2:34]], axis=1)
df = df.fillna(0)  # 行145..190cm 列37..100kg

height = []
weight = []
for i in range(46):
    for j in range(64):
        n = int(round(df.iloc[i,j] * 10))
        height = np.append(height, [i+145] * n)
        weight = np.append(weight, [j+37] * n)

rng = np.random.default_rng()

def jitter(x):
    return x + rng.random(len(x)) - 0.5

plt.figure(figsize=[7, 7])
plt.plot(jitter(height), jitter(weight), ".")
plt.xlabel("height (cm)")
plt.ylabel("weight (kg)")
plt.title("17歳 男")
plt.savefig('191027a.png', bbox_inches="tight")
相関係数
np.corrcoef([weight, height, height**2, height**3, height**4])
は
array([[1.        , 0.42350688, 0.42390102, 0.42405993, 0.42398417],
       [0.42350688, 1.        , 0.99970906, 0.99883893, 0.99739424],
       [0.42390102, 0.99970906, 1.        , 0.99971011, 0.99884296],
       [0.42405993, 0.99883893, 0.99971011, 1.        , 0.99971108],
       [0.42398417, 0.99739424, 0.99884296, 0.99971108, 1.        ]])
となり,3乗の相関が一番大きいが,違いはほとんどない。
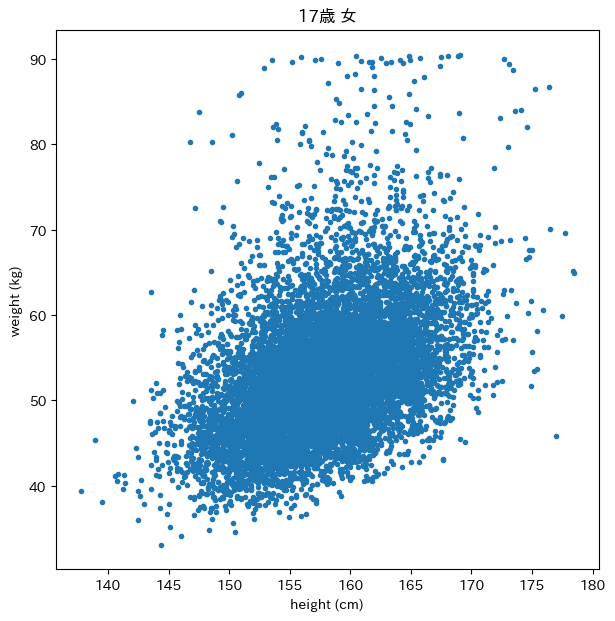
女子。
df1 = pd.read_excel("h30_hoken_eturan_01.xlsx", "10-041",
                    skiprows=[0,1,2,4], na_values="-")
df2 = pd.read_excel("h30_hoken_eturan_01.xlsx", "10-042",
                    skiprows=[0,1,2,4], na_values="-")

df = pd.concat([df1.iloc[0:43, 3:33], df2.iloc[0:43, 2:30]], axis=1)
df = df.fillna(0)  # 行136..178cm 列33..90kg

height = []
weight = []
for i in range(43):
    for j in range(58):
        n = int(round(df.iloc[i,j] * 10))
        height = np.append(height, [i+136] * n)
        weight = np.append(weight, [j+33] * n)

plt.clf()
plt.plot(jitter(height), jitter(weight), ".")
plt.xlabel("height (cm)")
plt.ylabel("weight (kg)")
plt.title("17歳 女")
plt.savefig('191027b.png', bbox_inches="tight")
np.corrcoef([weight, height, height**2, height**3, height**4])
array([[1.        , 0.43228155, 0.43256623, 0.43261141, 0.43241617],
       [0.43228155, 1.        , 0.99972306, 0.99889131, 0.9975034 ],
       [0.43256623, 0.99972306, 1.        , 0.99972231, 0.99888773],
       [0.43261141, 0.99889131, 0.99972231, 1.        , 0.99972126],
       [0.43241617, 0.9975034 , 0.99888773, 0.99972126, 1.        ]])
こちらも3乗の相関が一番大きいが,違いはほとんどない。
分布の形から見て女子のデータのほうがサチってないので,こちらで計算を続けると,分布が左右対称であれば歪度(skewness)は 0 になるはずであるので,調べてみる:
pd.DataFrame(height).skew()           # 0.092451
pd.DataFrame(height**3).skew()        # 0.293783
pd.DataFrame(weight).skew()           # 1.077402
pd.DataFrame(weight**(1/2)).skew()    # 0.765789
pd.DataFrame(weight**(1/3)).skew()    # 0.668884
pd.DataFrame(weight**(1/4)).skew()    # 0.621595
pd.DataFrame(weight**(1/100)).skew()  # 0.4894
pd.DataFrame(np.log(weight)).skew()   # 0.484013
身長はほぼ歪度 0 であるが,体重は3乗根にしても100乗根にしても歪度 0 にならない。体重は身長の3乗(2乗?)に比例するので正規分布から外れるといった説明は,正しくなさそうである。